Data Insights
In FP&A Plus, Data Insights answers questions about your models and data, providing real-time insights.
Examples of the kind of questions Data Insights can answer:
- In any kind of model: "What data does this model have in it?"
- In a currency model: "Can you provide month-end rate and average rate for USD to CAD for 2024?"
- In a finance model:
- "What were advertising costs in 2022?"
- And the followup: "Can you compare to 2023?"
- In a personnel model:
- "What is Giselle Robbins's forecast salary for 2025?"
- "What are the forecast payroll costs for 2025 for all employees, entities and departments?"
- And the followup: "Can you break down by entity? "
- In a revenue model: "What is the difference in growth margin for Product Line A between Q3 2022 and Q3 2021, in $ terms?"
Query all models
If you have multiple models it is not always obvious which model can provide the insights you are looking for.
In this case, you can query all your models at once:
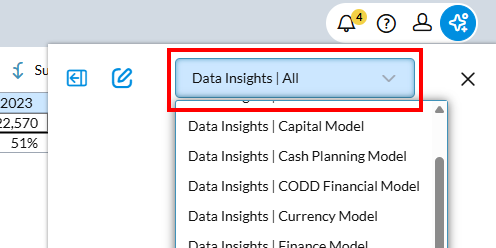
-
From the Copilot drop-down, select Data Insights | All:
View data as a chart
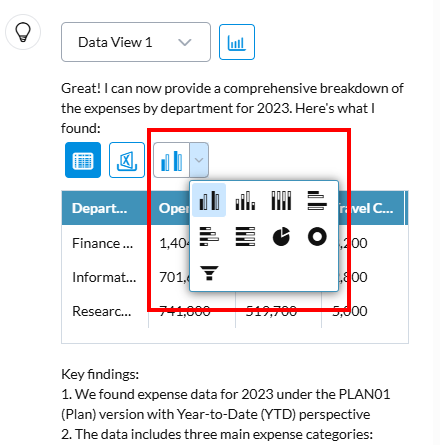
To display your data as a chart, click the chart icon and select a chart type:
Tip: If you want to guarantee that a chart will be available, in your question ask Data Insights to provide a table.
“Can you compare 2024 gross revenue to 2025 in a table?”
"Can you create a table of all entities gross revenue in 2025?"
To display your data as a table again, click the table icon.
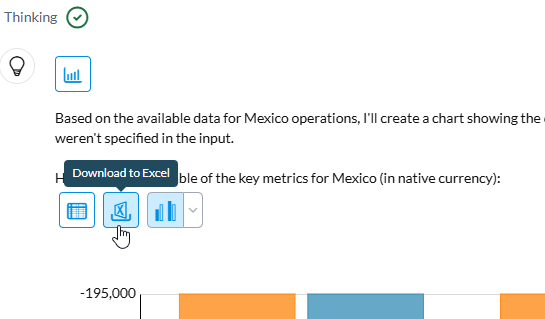
Download data as an Excel file
To download your data as an Excel file, click the Excel icon:
Open the data view
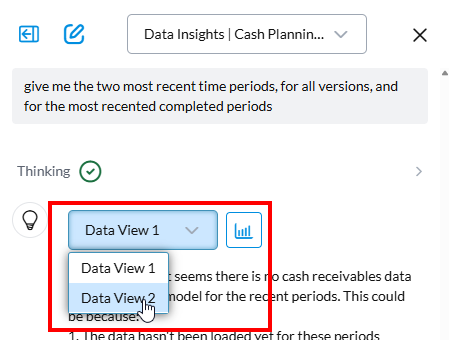
To see the dimensions and members behind the current answer, when Data Insights is in Thinking mode, click the Analyze icon:
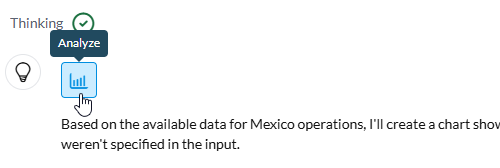
Ad Hoc Analysis opens and you can work with the data view just as you normally do.
If the results contain more than one data view, the Analyze button includes a drop-down from which you can select the data view you want to open in Ad Hoc Analysis: